.png)
.avif)
.png)

.svg)


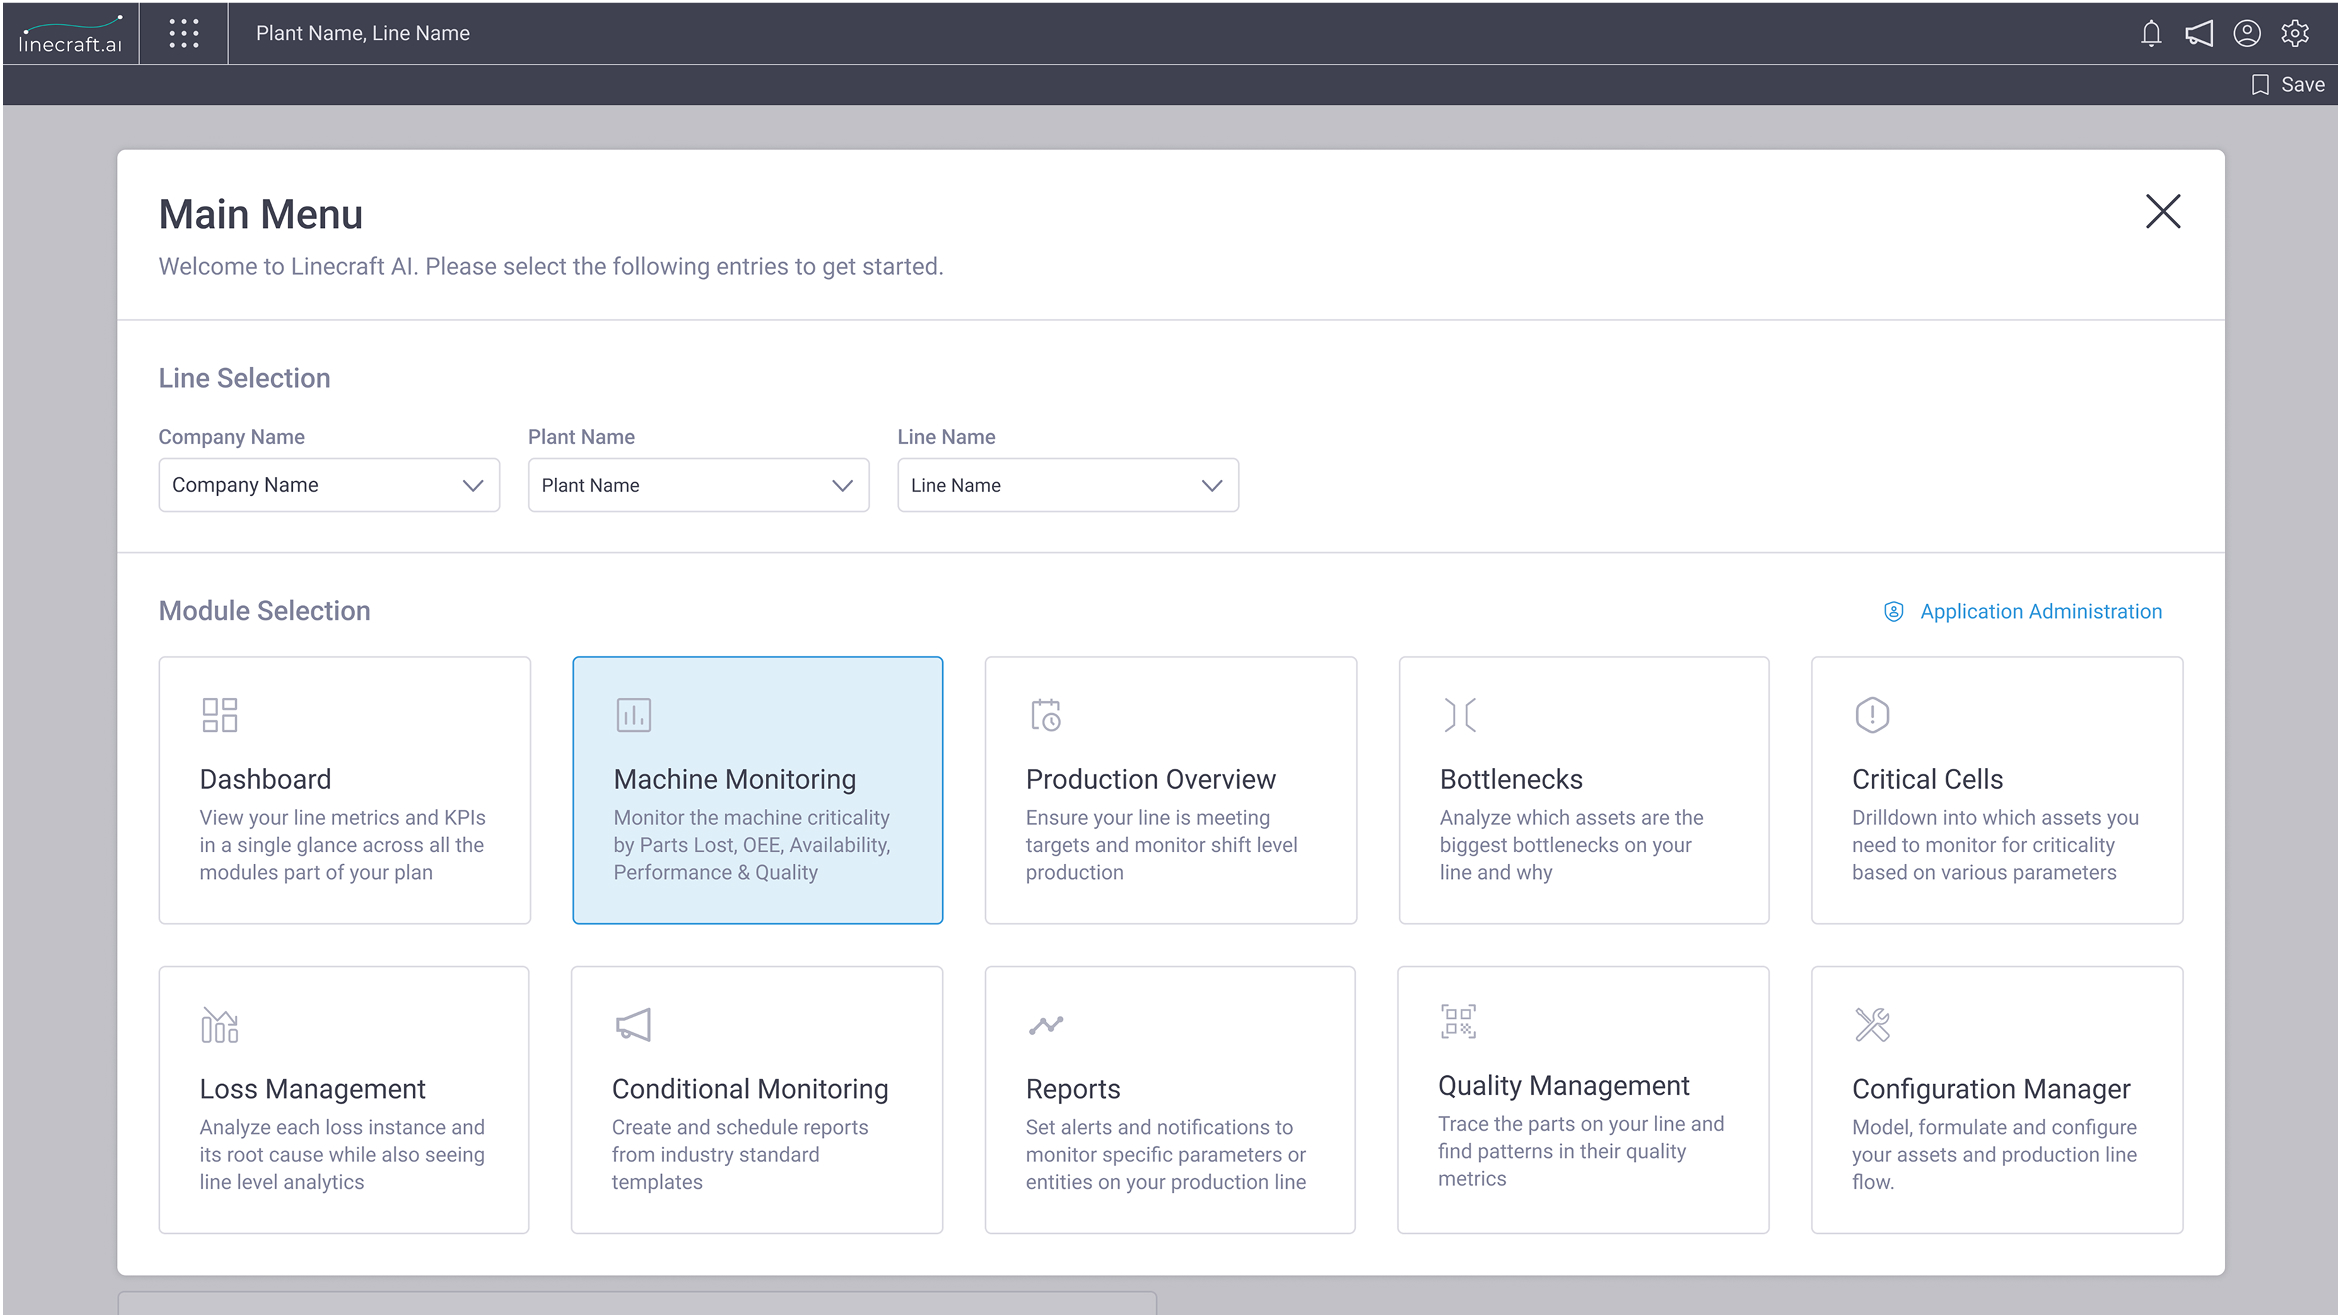
Realtime Machine Overview
Helps track the live status and key metrics of all machines on the line, enabling instant visibility and faster issue response.

Machine Statistics and Overview
View OEE, uptime, downtime, and defects for quick insights.

Machine Parameters Overview
View and track key metrics like temperature, speed, and pressure in real time through tabular or graphical views to understand trends.

Heatmap
Visually highlights machine performance and fault patterns using color gradients, enabling quick identification of issues and prioritization of maintenance.